Recession Likely
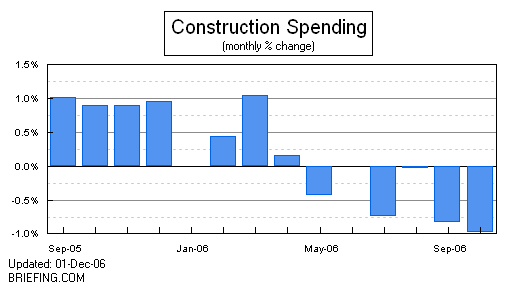
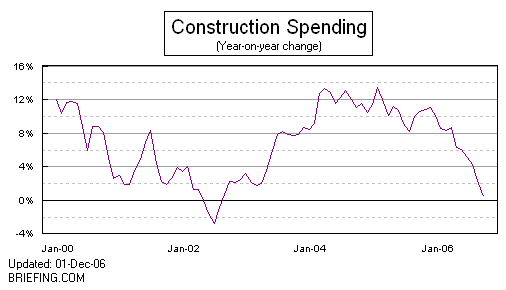
Today’s Construction Spending and Manufacturing reports provided still further evidence of a sinking economy. The 2 graphs below from Briefing.com show the overall trend.


Construction Spending declined 1%, leaving an annualized, seasonally-adjusted rate of $1.16 trillion. This was the largest decline since the recession in 2001. Residential Construction fell 1.9% in the last month. Residential Construction spending has also fallen for 7 consecutive months.
Since March, 100,000 housing-related jobs have been lost. Economist Zoltan Pozsar from Moody’s Economy.com, in today’s Yahoo News estimates that 300,000 more housing-related jobs will be lost in the next year.
Manufacturing also declined in today’s report. This is the first contraction in the Manufacturing sector in almost 4 years. Manufacturing employment also declined in November, with the ISM Manufacturing employment index declining to 49.2 in November from 50.8 in October. (Readings under 50 indicate a contraction.)
The dollar has dropped 3% in relation to the Euro in the last week, and 1.4% since Thursday morning (11/30/06).
The stock market has declined for the 2nd straight week.
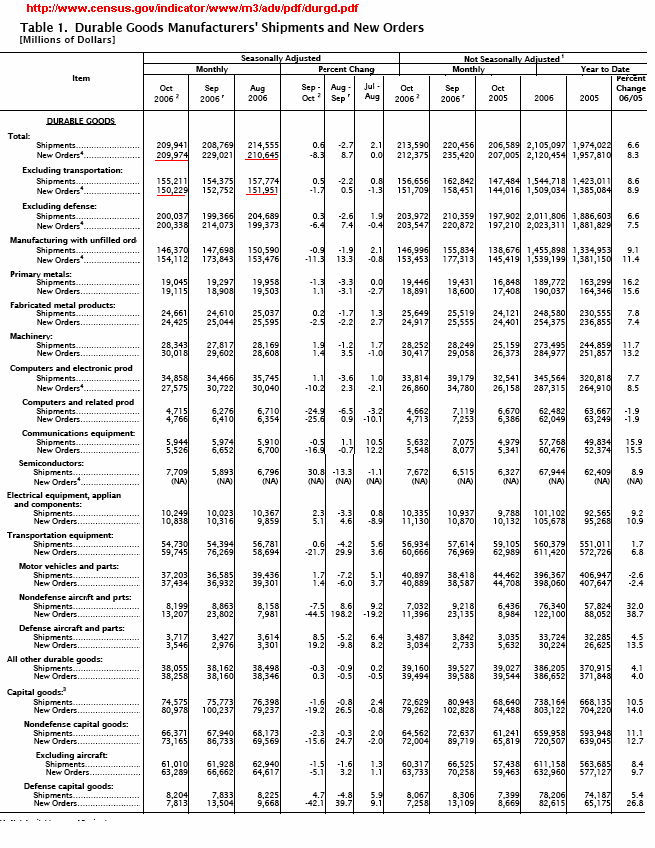
All of this follows November 28th’s Durable Goods, which was much larger than predicted. The original Durable Goods orders prediction was for a decline of only 6.0%. The actual change was a -8.3%. Though much of this was simply an offset from last months increase “alleged” 8.7% increase, October’s total is still 0.3% less than August’s, and 0.38% less than July’s.
The August through October numbers can be seen on the chart below from the U.S. Census Bureau. The Durable Orders totals are underlined in red, as are the “Excluding Transportation” totals.

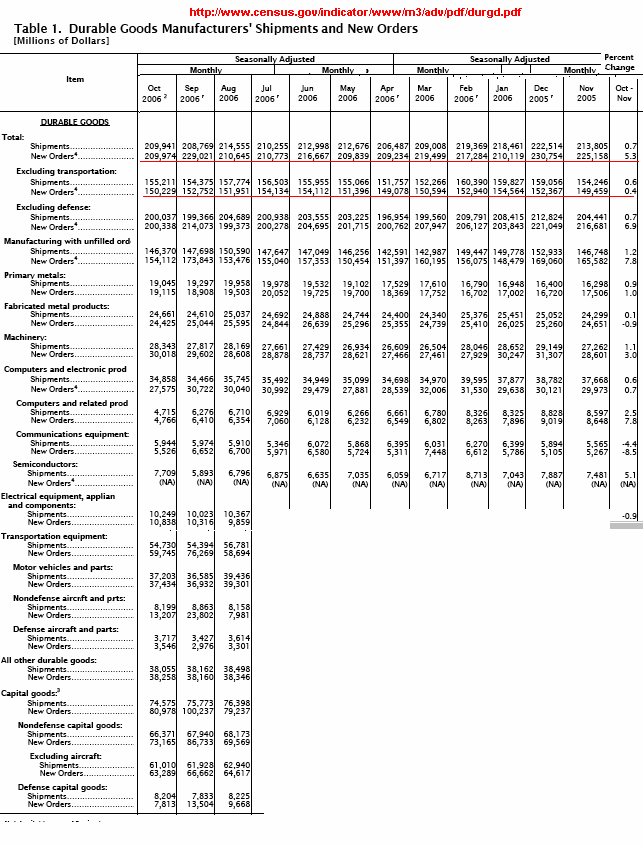
More importantly, Durable Goods orders have declined compared to October 2005, for a same month change of -1.8%. This can be seen from the composite chart below, made from the superimposition of monthly Durable Orders reports from the previous months, with information on the furthest month back coming from the January 2006 report by the Census Bureau.
(October 2005’s total was not available, so it was extrapolated from the percentage increase given between October – November 2005 change, shown in the far right column.) Once again, the Total and Ex-Transportation numbers are underlined in red.

From the above chart it appears Durable Orders peaked In December 2005, and have been generally declining since that time. Compared to December 2005’s peak of $230.754 billion, October of 2006 is down 9% to $209.974 billion.
Meanwhile, the Corporatists and the NeoCon-Artists continue to claim the economy is “the strongest ever” and claim the statistics support them. Of course, they never give those “supporting” statistics. There’s a reason for that. There aren’t any. The economy is sinking and a recession is very likely within the next year. All the Right-Wing propaganda in the world isn’t going to change this.
unlawflcombatnt
The economy needs balance between the “means of production” & “means of consumption.”