
Crossposted from European Tribune.
It’s funny how things happen sometimes. After the New Hampshire primary last Tuesday there were some suggestions that the Democratic primary might have been tampered with. I have taken part in some discussions of this on and off the blog, and my basic take was that
- the implications are important enough for the allegations to be taken seriously;
- “taking the allegations seriously” means carrying out some further tests before jumping to conclusions, especially if you’re going to call for an official recall like Dennis Kucinich has done!
My initial suggestion was to compare the actual vote counts by hand vs. by machine against the exit polls, if an exit poll could be found that aggregated the data according to the vote counting method used in the precinct where the voter was interviewed. Of course this variable was not in the published exit polls. In my enthusiasm I imagined someone in the blogosphere knowing someone in one of the companies that do exit polls, so they could try to get the raw data from election night re-analysed. But see below. - if a statistically significant discrepancy between the vote percentages and the exit polls, aggregated separated by vote counting method, were found, one would have to remember that correlation doesn’t imply causation. One could imagine socioeconomic variables correlating independently with both the Clinton/Obama swing and the use of voting machines in a precinct. For instance, rural vs. urban precincts, the size of the town, the average income of the town, whether the local government is democrat or republican controlled, etc. All of these plausible explanations would have to be controlled for before one could claim to have evidence of election fraud.
Given the impossibility of getting my hands on disaggregated exit poll data and the observation that the exit polls matched the election results (but see below), I decided not to give the issue any more thought. That is, I ceased to take it seriously.
However, supporters of both Ron Paul and Dennis Kucinich among other people didn’t lay this to rest and started posting fragmentary statistical analyses of actual voting data. These got more and more elaborate until, earlier today, Drew, who had nagging suspicions and so had been tracking what the blogosphere was saying about this issue, pointed me to a couple of websites that changed my mind, because they contain serious statistical analysis of the kind I suggest in 3) above, albeit performed only on the election data, not on exit polls. But that is actually better as I’ll also discuss below.
Now I think there is a high likelihood that the vote counts for Obama and Clinton were exchanged by Diebold voting machines.
The first indication that something might be amiss came in this comment by ThatBritGuy:
From a comment by “soros” at the big orange monster:
Then there is this other indication from the Election Defense Alliance
Thursday 1/10: Bruce O’Dell writes:
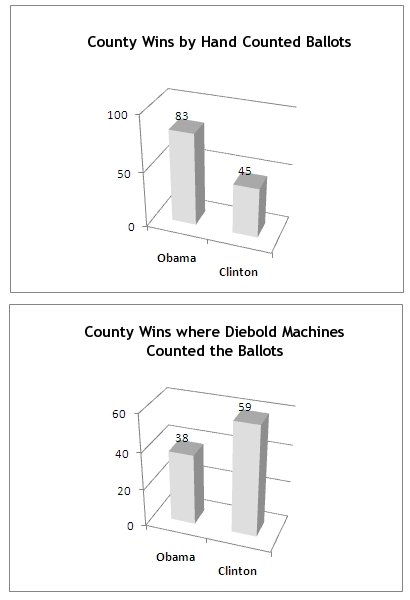
Theron Horton and I have confirmed that based on the official results on the New Hampshire Secretary of State web site, there is a remarkable relationship between Obama and Clinton votes, when you look at votes tabulated by op-scan versus votes tabulated by hand:
Clinton Optical scan 91,717 52.95%
Obama Optical scan 81,495 47.05%Clinton Hand-counted 20,889 47.05%
Obama Hand-counted 23,509 52.95%The percentages appear to be swapped. This seems highly unusual.
The coincidence is even more suspicious than it appears as the percentages match to 5 decimal places, as was discovered by a commenter on Brad Blog
COMMENT #57 [Permalink]
… TruthIsAll said on 1/10/2008 @ 10:14 pm PT…Brad, the coincidence is even greater than that. The numbers match to within .0001% !
Optical Scan
Clinton 91,717 52.9507%
Obama 81,495 47.0493%
Total 173,212Hand Counted
Clinton 20,889 47.0494%
Obama 23,509 52.9506%
Total 44,398
Let’s do a back of the envelope calculation… Let’s take the percentages “measured” from the optical scan ballots. Suppose you have a biased coin with a head on each side, Clinton or Obama, and with a 52.9507% probability of coming up Clinton and a 47.0493% probability of coming up Obama. Now take the total number of hand-counted votes. Toss that coin 44,398 times. What do you expect? Well, the expected number of Clintons is 44,398 * 0.529507 = 23509.1 which is exactly as observed for Obama, and the expected number of Obamas is 20888.9 which is also exactly as observed for Clinton. Now, the expected variance of a coin toss will be 0.529507 * 0.470493 = 0.249129, so the expected variance of 44,398 coin tosses is 11060.8 and the standard deviation is the square root of that, or 105.2 so you would expect the observed vote counts to deviate from the expected ones by about 100 votes in either direction. The fact that they match to within 1 vote means that the match is too good to be true. We’re talking as unlikely as a 3-sigma deviation. If you’re a teaching assistant and a student turns in a lab report with data of this quality you suspect them of doctoring their data to match the textbook answer and call them to your office for cross-examination.
So, these data contain not one but two red flags. The first is that the vote percentages are exchanged, and the second, more subtle red flag, is that the vote counts are too god to be true.
Now for the couple of links that I got from Drew that convinced me that something really is amiss by addressing my suggested tests in point 3) above the fold.
The first one is from “Brian” at Black Box Voting:
I wanted to do a quick statistical analysis of the results. This is far from complete, but the results thus far do not contradict our initial suspicions.
First a very basic statistics primer. We assume that our samples are subject to “noise” (random variation). Obviously the percent vote counts are not going to be the same in every precinct, so when we see what we think is a trend (like Obama doing better in hand-counted precincts) we ask, “what is the probability (p) of this apparent trend arising by chance?” If the probability is less than 5% (p < 0.05) we say that the result is “statistically significant.”
Ok, now the results.
First I ran a chi-squared contingency table tests with Yates correction. for both the democrat and republican results.
…
Thus we can say with a high degree of certainty that there is a relationship between the counting method and the election results. The probability of the aforementioned discrepancies occurring by chance is less than 1 in 100 billion.
This does not mean however that counting method causes different voting percentages, just that they are correlated. It could be that something else (e.g., size of town) causes both. As a quick control I did the same chi-squared analysis, but looking at just whether people voted democrat or republican. Below, the columns are machine counted, hand counted and the rows are republican, democrat.
…
That is, while the machine counted precincts tended to vote slightly more republican (54.9% vs. 54.6%) this result was not significant (p > 0.05).
If one was cheating by vote substitution one would not want to change republican ballots to democratic or vice versa for obvious reasons. It is interesting that the machine/hand counted precincts have such different results within each election, but are almost identical between the two elections.
The next question is whether other factors can explain the discrepancy. This is very much a work in progress. Preliminary results indicate that neither Obama’s nor Clinton’s percentages have a significant correlation with precinct size. They both fit a line with slope zero. This would suggest (very preliminary) that the trend of smaller precincts tending to use hand counts cannot explain the discrepancy.
But the one that really blew my socks off was this other one from the blog Continuation:
Some people offered the explanation that smaller precincts tend not to use Diebold machines and also tend to favor Obama, for whatever sociological reasons. As someone put the election data in computer-readable format on the web, and as I am slightly versed in statistical analysis using the R package, I decided to run some tests.
…
In hand-counted precincts, which make up 20.2% of the votes, Obama gets 38.6% and Clinton gets 34.9%. In Diebold-counted ones, Clinton makes 39.6% and Obama gets 36.3%. This is the basis for the initial claims of vote rigging.
Claims which are countered by the observation that precincts where the votes are hand-counted are small, non-urban precincts. Urbanity is, of course, a well-known factor affecting political choices.
…
Actually there is a very significant correlation at p < 0.002 between Clinton’s score and the precinct size, and an even better correlation between Clinton’s score and voting method, and yet a better correlation between precinct size and voting method.
We cannot say much more without going to multivariate statistics. Fortunately, thanks to GNU R, mere mortals can benefit from multi-variate statistical modeling.
…
These cryptic lines mean that Hillary’s score can be computed by 38.59% plus the Democratic size divided by 384911.5 (which is 1/2.598e-6) minus 4.64 percentage points whenever the voting method is by hand.
So it is estimated that voting method accounts for 4.64 percentage points of Hillary’s score.
How much variability does this linear formula remove from the data? The standard deviation (on a precinct by precinct basis) of Hillary’s score is about 7.8 percentage points.
…
Look at the t value! As you can see, voting method explains a lot better than precinct size.
…
Now let’s think a little bit. There could very well be a politically meaningful parameter correlated with voting method besides precinct size. As Diebold has connections with Republicans, it could be that Republicans favor Diebold. Could it be that the Republican to Democrat size ratio explains the voting method?
I’ll spare you the R screen dump: the p-value of the correlation coefficient being 0.69, the R to D size ratio doesn’t seem to explain anything.
So, after I told Drew that this Continuation guy had hit jackpot, he decided to forward a bunch of these links to the Kucinich campaign to help them with the recount effort. Apparently Drew ended up on the phone with Kucinich, who would really appreciate having a detailed report of the statistical evidence before Monday (US time). And why, oh, why would Kucinich need as watertight as possible a report on so short a notice? Because, as you can see from the PDF press release linked to here
PRESIDENTIAL PRIMARY – JANUARY 8, 2008
Results of the Presidential Primary will be posted at the above link after tabulation is complete (Wednesday, January 9, 2008)
Press Release Regarding Republican and Democratic Recounts
the New Hampshire Secretary of State is required to estimate the cost of a full recount, which would have to be paid by Kucinich (at least for the Democratic recount). Kucinich is not exactly swimming in cash, and also he’s sticking his neck out on this (he effectively called a full recount on a limb) and has some of his own credibility at stake if the recount ends up confirming the original result.
Here are a bunch of links to other blog posts, media sources and data sources that you are welcome to look at if you are so inclined. I am personally going to go to sleep now and tomorrow I’ll run my own set of regressions to try to independently validate the evidence presented here. So, if you have any suggestions on how best to do that, please put them in the comments. And please poke as many holes into this as you can.
http://politics.reddit.com/info/6512f/comments/c02uut9 precinct-level data used by Continuation
http://www.bbvforums.org/forums/messages/1954/71236.html?1200123051
http://www.bbvforums.org/forums/messages/1954/71287.html?1200186211
http://ronrox.com/paulstats.php?party=DEMOCRATS
http://www.boston.com/news/politics/2008/nh/nh_primary_dem_results_by_town/
http://www.bbvforums.org/forums/messages/1954/71200.html?1199885815
http://neggie.net/vote2008/nh_primary.cgi
http://www.sos.nh.gov/voting%20machines2006.htm
http://www.boomantribune.com/story/2008/1/9/94041/54372
http://www.eurotrib.com/comments/2008/1/10/224032/085/13#13
http://www.msnbc.msn.com/id/21225995/
http://www.bradblog.com/?p=5535
http://www.bbvforums.org/forums/messages/1954/NH_Data-71290.xls demographic data by town [excel]


Have tinfoil hat, will travel.
You gotta love America.
The published exit polls are normalized to match the official tallies, so they are not generally valid for checking those tallies, those if micro discrepancies survive macro adjustment, that would be interesting. However, both Chris Matthews and Bill Maher have stated that the unaltered polls showed Obama strongly ahead. Deeply suspicious in itself, independent of other factors. Like I said in the other thread, if we could just get the media to release raw exit poll data by precinct, we could correlate with counting method ourselves. But I doubt we could do that outside of court, and whether it is possible in court is beyond my knowledge.
in DIFFERENT PLACES.
You CANNOT EXPECT the rural (hand) and urban (opscan) locales to act the same. Thus, running a chi-square comparison is simply stupid.
It ain’t the hand counting. It’s the voting behavior that is different.
i was hoping for an Obama victory. but is is simply stupidity to claim that since things were different in different places, its due to evil. It’s probably due to the different places.
Not true, actually.
As it turns out, in both cities and rural districts, these strange anomalies persist.
See this paper, by two mathemeticians:
http://electionarchive.org/ucvData/NH/DemPrimary2008-PairedPrecinctStudy.pdf
That’s somewhat more troubling.
Hopefully, at least a statistically appropriate subsample of the precincts will be recounted by hand.
Your argument amounts to hand waving and talking loud. You really ought to get acquainted with migeru before you start calling him stupid.
Yikes!
Like any of these people might need my help! LOL
Not intimidated! Nope, not me :o)
The only comparison which is worth even looking at is a recount of machine-counted precincts by hand. All of this statistical stuff is not valid, because it all assumes various things like homogeneity of preference across the state, and that is simply ridiculous. I know the stats. You cannot make a statistical argument without paired precincts. Even then, most arguments are nonsense.
What is needed is a recount of 2-5 % of randomly sampled machine-counted precincts. 5 % is overkill, 2 % is probably enough.
And I gave you the link to paired precincts, which show the same anomaly. We’ll see what Wednesday shows us.
If there was an error, I suspect evidence of it will be readily apparent. If there was fraud, however, I expect the results will be far more murky.
In Orange County, California, in 1998, a proposition’s votes were altered (“accidentally”) such that all yes votes went into the no column, and vice versa.
If that happened here, that’s actually the simplest explanation for what happened, one that would explain all the known data.
That’s why a recount is important. It starts on Wednesday.
I think it’s premature to try to explain the results until we first find a way to CONFIRM the results.
I’ve read the Euro Tribune thread and I’m floored by the level of intense investigation going on there and the help you’re recieving. The math though, tends to cause cracks in my skull :o) But it’s pretty clear even to someone who’s mathematically challenged that something looks amiss. It’s been trip back in time reading this and the links to TruthIsAll’s work as he was one of the first people I found when I first ventured onto blogs in Nov. 2004 after feeling sick and instinctually knowing something was wrong. It’s good to know that he, you and others are hard at this. Big thanks and respect to Congressman Kucinich as well.
Thanks
Something does, indeed, look amiss. The truth is that we think we know what happened. Now it’s a matter of continuing to gather information, and getting a brief, but strong, summary to Congressman Kucinich.
So, while you might be mathematically challenged, — so am I, and I’m an economist! — you can certainly help us if you’re up for it, supersoling.
I don’t know what help I might offer, other than doing searches for related info. Even that is a problem as I’m on a dialup connection with my PC and am browsing now through a Nintendo Wii system, of all things, which has no copy and paste function and little if any memory.
But…I’m game to help where I can :o). Point me in the right direction.
Thanks for this diary, Migeru.
I admire Kucinich for taking this on.
But: There is a danger here, called the chain of ballot custody. It is very important to know who had physical custody of the ballots from the time of counting by the Diebold machines to the time of recounting (by hand).
The danger of tampering to make the recount results match the Diebold results is very real. Blackbox voting has already commented on how Kucinich could get sniped on this, if folk are not very, very careful.
To change topic: I am glad this is being raised, but continue to be astonished at where people put the burden of proof: Diebold machines are ALREADY KNOWN to be BOTH unreliable AND hackable. On its FACE the New Hampshire primary is invalid.
It’s not just the powers that be. Pretty near NOBODY is serious about this so-called democracy of ours.
I agree — who has controlled access to the ballots this past week?