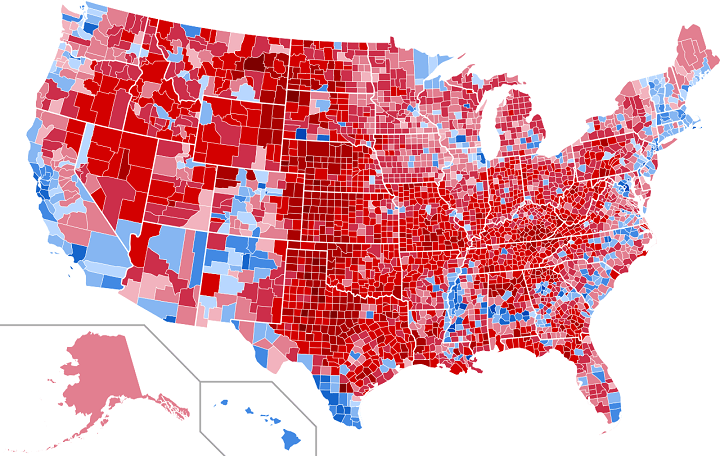
Getting a leadership the nation deserves besides the influence of corporatism and the UNSC decisions on voting rights, gerrymandering, etc. …
As the GOP steals the presidential election here, let’s point fingers at the Red Menace over there!!
After Obama’s 2008 Win, Indiana GOP Added Early Voting in White Suburb, Cut It in Indianapolis
In 2008, Barack Obama squeaked out an unexpected win in Indiana thanks in part to his huge margin of victory in Marion County, which has a large population of black Democrats. The state’s Republicans got to work right away, cutting early voting in Marion County, which includes the state capital of Indianapolis, while expanding it in a nearby suburban county filled with white Republican voters.
That’s the distressing but entirely predictable upshot of a blockbuster report published by the Indianapolis Star on Thursday. The Star found that between 2008 and 2016, Republican officials reduced the number of early voting stations in Marion County from three to one, resulting in a 26 percent decline in absentee voting in the 2016 presidential election. (Early votes are cast via absentee ballots.)
Meanwhile, officials added two early voting stations to the neighboring Hamilton County, which is populated primarily by white Republicans. The county saw a 63 percent increase in absentee voting in 2016. There is now one early voting station for every 100,000 voters in Hamilton County and one for every 700,000 voters in Marion County. In total, the number of people who voted in Marion County decreased by 11,261 between 2008 and 2016 and increased in Hamilton County by 27,376–this “despite an increase of registered voters in both counties,” the Star reports.
ELECTION 2008 D-R 2012 D-R 2016 D-R 2008 | 2016
Marion Co. 237.3 - 131.5 215.5 - 136.1 212.7 - 130.2 -10.4 | -1.0
Hamilton Co. 49.7 - 78.4 43.8 - 90.7 57.2 - 87.3 +15.1 | +11.4
Boone Co. 9.7 - 16.6 8.3 - 18.8 10.2 - 19.7 +17.2 | +18.7
Johnson Co. 21.5 - 36.5 17.1 - 39.1 17.3 - 45.5 -19.5 | +24.7
Hendricks Co. 24.4 - 39.6 21.1 - 44.3 22.6 - 48.3 -7.4 | +22.0
TOTALS of above 341.6 - 302.6 305.8 - 329.0 320.0 - 331,0 -6.3 | +9.4
Difference +39.0 +23.2 +11.0 change %
Indiana won/lost Dem 26.2 Rep 172.2 Rep 524.3
(votes x1000)
Here Are 7 Electoral College Predictions for Tuesday | TIME |


