

I never studied economics in college, but I did attend law school. In fact I graduated 4th in my class. The standard buzz phrase that law school professors drum into the heads of their students is “think like a lawyer.” What do they mean by that? It’s simple. Look at the facts, not theories, not beliefs. Each case is different.
I went to work as a new attorney in the mid-80’s. I started in bankruptcy representing both companies in reorganization and creditors. I learned a lot about why companies fail, and why bank loans go bad, because I had to educate myself in order to represent my clients. I learned enough accounting to recognize when a company’s financial statements were accurate and when they were nothing more than refried bullshit. Mostly I learned to trust facts — not opinions, not hopes, not wishful thinking — just the facts.
So, here I am offering you a “Dummy’s perspective” on the economics of our national debt. Not economic theory, just facts, which are available to anyone who bothers to look for them. Here’s the lessons I’ve learned after looking at those facts:
1. You stop taking in revenues, you run up big debts.
US debt in 1980 (Carter’s last year) = $930,210,000,000. In 1980, the percentage of the National Debt compared to Gross Domestic Product (GDP) was 33.3%, or -2.5% less than it was at the end of the Ford administration (though the overall National Debt had grown by 142%). In short, the GDP expanded faster than the national debt under Carter.
Reagan took office in 1981. Let’s look at his numbers for 1984 and 1988, shall we.
1984: National Debt = $1,662,996,000,000.
That was an increase in the National Debt from 1980 of 179%.
The National Debt was 42.3% of GDP in 1984, or an increase of +9.0%. In short, during Reagan’s first term, the economy as represented by GDP grew much, much slower than did the National Debt.
What happened? Well, one thing that happened was that the highest marginal tax rates dropped a bit. Quite a bit.The top marginal income tax rate in 1980 was 70% on income over 108,000 for a single individual ($319,060.87 in 2010 dollars). The top marginal rate in 1984 was 50% for income over 81,800 for a single individual ($176,127.64 in 2010 dollars). So, tax revenues declined relative to spending.
Now let’s look at 1988, Reagan’s last year when his tax policies should have been increasing tax revenues as predicted by the economists and advisers he favored.
1988: National Debt = $2,684,392,000,000.
That was an increase in the National Debt from 1984 of an additional 161%%.
Furthermore, the National Debt in 1988 was now 52.6% of GDP in 1988, or an increase of +10.3% over 1984 and A +19.3%. increase over 1980. GDP continued to grow slower than the National Debt. Overall, the National Debt increased between 1980 and 1988 by an astounding 289%. Those are rather an astonishing increases.
Oh and what about those top marginal income tax rate in 1988? It was 28% for a single person with income over $17,850 (33,598.21 in 2010 dollars). That was the lowest marginal rate since the 1920’s. Of course, it also extended to most people in the middle class, instead of people only in the upper income levels so there was that benefit. Still there is no getting around the fact that Reagan nearly tripled the National Debt in eight years. Oh and he raised FICA taxes which impacted the middle class far more than they did the wealthy.
Then came Bush Sr. In his four years, the National Debt rose to $4,177,009,000,000 and represented 65.9% of GDP. He increased the National debt in his four years by 156%. Still, by his last year in office he had raised the highest marginal tax rate to 31% on income over $51,900 an increase of 3% for people making the equivalent of $81,760.44 last year.
Still, in the twelve years of the Reagan/Bush era, the National Debt had grown tremendously, from 930,210,000 ($2.748 Trillion in 2010 dollars) in 1980 to $4,177,009,000,000 ($6.49 Trillion in 2010 dollars). In absolute terms, the debt rose between 1980 and 1992 by 450%. Even in dollars adjusted for inflation, 12 years of Republican rule grew the National Debt by 236% and increased its value from 33% of our GDP to effectively double that, or 66% of GDP. Quite an accomplishment.
Which brings me to my second lesson:
2. When you increase revenues you lower you debt.
Under President Clinton, the highest marginal tax rate was raised to 39.6% on individuals earning more than $250,000 in 1993 ($393,836.42 in 2010 dollars), which rose to $288,350 in 2000 ($454,250.92 in 2010 dollars). The next marginal rate was 36% on income over 115,000 in 1992 ($181,164.75 in 2010 dollars), which rose to 132,600 in 2000 ($208,890.83 in 2010 dollars). So what happened to the National Debt in President Clinton’s 8 years?
2000 National Debt = $5,662,216,000,000.
That was an increase of $1.485 Trillion from 1992, Bush Sr.s last year in office. However, as a percentage of GDP, the National Debt declined 18.2%. Furthermore, when we compare the debt adjusted for inflation we find that Bush left the debt at $6.49 Trillion (2010 dollars) while Clinton left office with the dent at $7.29 Trillion or an increase of only roughly 900 Billion 2010 dollars.
Clinton didn’t raise taxes all that much, and the largest tax increases fell on people who in today’s economy would be earning in excess of $400,000 to $450,000. Yet he left office with a significantly lower National Debt to GDP ratio and a $500 Billion budget surplus.
Which brings us to my third lesson:
3. When You Raise Spending and Cut Taxes, your debts multiply astronomically.
Yes, this section is all about the George W. Bush years. In 2003, Bush cut the top marginal rate on individual income to 35% on income over $311,950 ($371,690.19 in 2010 dollars). By 2008, this top marginal rate for individuals only covered income in excess of $357,700 ($369,807.42 n 2010 dollars). In essence, after adjusting for inflation Bush cut the tax rate for income over 370,000 by -4.6% compared to the Clinton years.
But he did more than that of course. He also cut the Capital Gains rat from 20% to 15% for those in the highest income brackets beginning in 2003. And of course, he increased the estate tax exemption incrementally between 2002 -2009, and eliminated the estate tax effective 2010.
Bush also fought two wars (total cost as of today around 1.231 Trillion) )and created a Medicare Prescription Plan, cut corporate tax rates. All this was supposed to magically create a robust economy, more jobs and more tax revenue. What really happened? Well let’s keep it simple and look just at the national debt under Bush No. 2.
When Bush left office in 2008, the debt was at $10.7 trillion (about 11.1 Trillion in 2010 dollars).
National debt represented 74.1% of GDP, an increase of +16.4% over Clinton. Bush also left the economy in shambles, in the worst recession since the Great Depression. Even during the “flush years” before 2008, the economy under Bush generated the lowest job creation in history during a recovery according to the Wall Street Journal (though the stock markets did record new highs).
Since Bush left office, Republicans have prevented any increase in tax revenues. Indeed, they argue we need more and more tax cuts (except for poor people and the middle class). The Obama stimulus bill passed with a few Republicans in the Senate but only because it included tax cuts in it. Not surprisingly tax receipts have taken a nose dive. Jobs have not recovered.
One might ask why, after decades of showing the impact of tax cuts on the growth of our national debt does anyone still believe that we can lower the national debt without increasing taxes on the top income earners and corporations who have profited so greatly during Republican administrations?
Take a look at this chart:
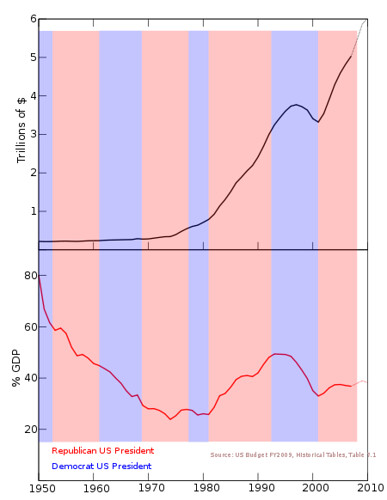

It’s clear, that Republican control of Government, beginning with Ronald Reagan, created the explosion of our national debt. Things turned around during the eight years of the Clinton Presidency, when modest tax increases limited growth in the national debt while spurring an economic recovery, more jobs and a budget surplus. However, when George W. Bush returned to power the debt resumed its dramatic rise. In 30 years we went from a national debt that represented 33% of of GDP ( a very manageable level) to one that now is almost equivalent to our GDP. Except during the Clinton years, Republican tax policies, which lowered tax rates on the wealthiest Americans were in effect, and even Clinton’s tax hikes were marginal at best.
As I said, I’m no economist. I understand that there are other forces that played a role in our national debt increasing. But as an attorney I’d like to leave you with this Latin phrase familiar to any first year law student: res ipsa loquiter.
In short, the facts speak for themselves. We either raise taxes on the rich and the powerful corporations who (to paraphrase Dick Durbin’s words) own our Congress or we continue to permit our nation to continue on its ever increasing death spiral into insolvency, severely lower living standards for the overwhelming majority of our people, and the further rise in power and influence of those greedy rapacious few with vast sums money, money that has already corrupted our government and hollowed out all but the outer shell of our democracy.
Sources:
Federal Income Tax Rates: “Federal Individual Income Tax Rates History
Income Years 1913-2011,” Tax Foundation
Capital Gains Rates: “Federal Capital Gains Tax Rates 1988 – 2011,” Tax Foundation
National Debt Statistics: “US Debt By Presidential Term,” PresidentialDebt.org
All adjustments to 2010 dollars were made using this inflation calculator .