

(cross posted from dkos)
How do the senators line up? Are there groups of Senators with similar records (other than the obvious Dem vs. Rep?)
There’s a statistical tool to answer questions like this: It’s called cluster analysis. It takes a group of subjects (here Senators) and some method of saying how similar they are (here, ratings from various groups) and tries to put the subjects into groups.
There are LOTS of subtleties, some of them (along with results) are below the fold
There are several key questions to answer in a cluster analysis:
- How to measure similarity
- How to link a person to a cluster
- How to figure out how many groups there are
But all cluster methods are about finding, well….. clusters.
OK, let’s take these three one at a time:
1) How to measure similarity:
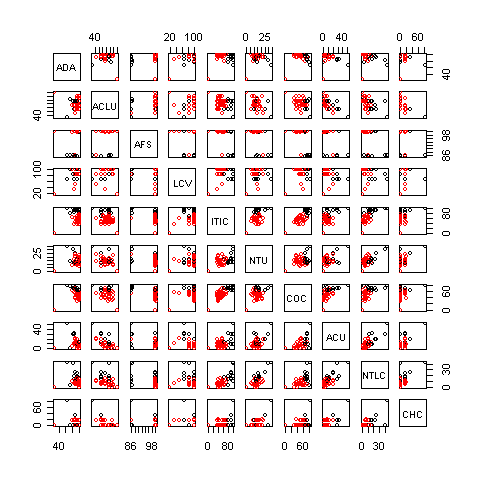
Here, I took ratings on each Senator from 10 groups, as collected by the Almanac of American Politics 2006. The ten groups each rate each senator for 0 to 100. The groups:
Americans for Democratic Action: A general, liberal group
Am. Civil Liberties Union: In favor of individual rights and civil liberties
AFSCME – A large union of public employees.
League of Conservation voters – pro-environment
ITIC – a group of information technology providers – mostly toward the conservative end
Nat’l Taxpayers’ Union – For lower taxes
Chamber of Commerce of the USA – pro-business
Am. Conservative Union – general conservative group
Nat’l Tax-limitation Commission – for lower taxes
Christian coalition – well, you know
Then, a measure of similarity is the correlation between their scores. Two senators with identical ratings will have correlation = 1, with completely opposite ratings, -1.
2. How to link people
Linking two people is easy: We start by linking the two who are closest to each other. But how do you measure the closeness of groups? There are a number of methods. In single linkage, you measure the shortest distance – that is, the shortest distance between anyone in the two groups. In complete linkage, you count the longest distance. In average linkage, it’s the average distance. Average distance is often a good choice.
Another method, which I use below, is k-means clustering, where we specify a number of clusters, and the computer finds the ‘best’ solution for that number of groups
3. Number of groups
Here, intuition plays a role. We can look at multiple numbers of groups and see what patterns emerge.
Before all that, though, let’s explore a bit.
I include all the people who were senators in 2004 and weren’t newly elected. Later, we can look at who got kicked out. There are 95 such senators.
There were (get this) 43 Dems and 56 Repubs and 1 indep. in total TIMES HAVE CHANGED! Among the 95, there were 42, 52 and 1.
The 10 organizations all ranged in rating from 0 to 100
| Group | Mean | Std Dev |
| ADA | 59.8 | 38.9 |
| ACLU | 39.1 | 32.5 |
| AFS | 51.2 | 44.0 |
| LCV | 45.5 | 44.24 |
| ITIC | 80.1 | 22.7 |
| NTU | 45.3 | 28.6 |
| COC | 75.9 | 23.5 |
| ACU | 53.0 | 41.0 |
| NTLC | 53.2 | 40.3 |
| CHC | 55.3 | 45.78 |
when you seen std. deviations almost as big as means, and you know that the minimum is 0 and max 100, you suspect bimodality:
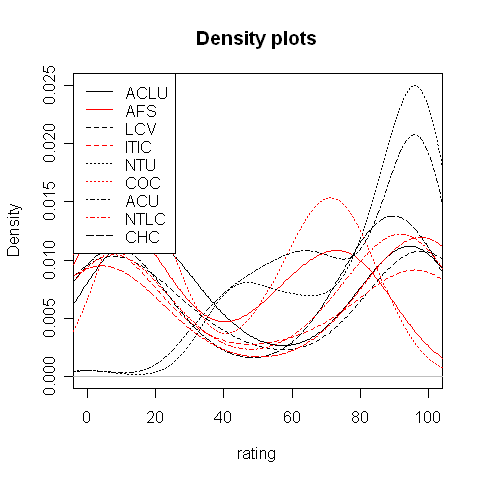
This is a density plot of each groups ratings, and, indeed, a lot of them are bimodal: A lot of senators get low ratings, and a lot get high ratings, with few in-between.
OK. First, let’s try a two cluster solution. This splits nearly perfectly along party lines, cluster 1 was 42 Dems, 1 Indep (Jeffords) and 1 Repub. Cluster 2 was 51 Repubs
Who’s the one Republican in with the Democrats? Lincoln Chafee
Seems that cluster is at least working, even if it’s not revealed anything too surprising.
We can also plot the scores on each of the groups, by cluster.
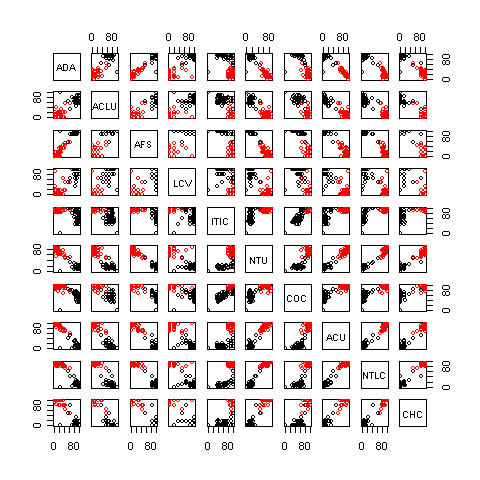
Here, cluster 1 is all the Dems, one Indep (Jeffords) and Chafee.
Cluster 2 is just the Repubs.
What about 3 clusters?
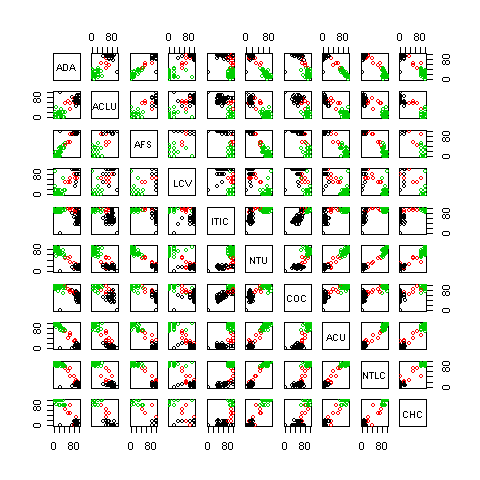
In this analysis, cluster 1 has 6 Dems and 3 Repubs, cluster 2 has 49 Repubs, and cluster 3 has 36 Dems and Jeffords.
Who’s in that first, mixed cluster?
Blanche Lincoln (D-AR), Mark Pryor (D-AR), Evan Bayh (D-IN), Mary Landrieu (D-LA), Snowe (R-ME), Collins (R-ME), Baucus (D-MT), Ben Nelson (D-NE), and Lincoln Chafee (R-RI)
A four cluster solution was not that useful, but it did put John Kerry (D-MA) in a cluster by himself. Otherwise, it was identical to the three cluster method
A five cluster solution, however, is interesting:
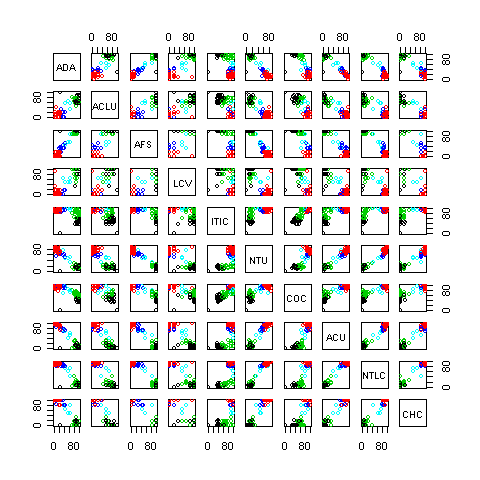
Clusters 2 and 4 (red and blue) are all Republican, clusters 1 and 3 (black and green) are all Dem. (plus Jeffords) and cluster 5 is 1 Dem and 4 Repub.
Let’s try clustering within party
These two clusters were quite similar on most scores, but cluster 2 is lower on several: ITIC, COC, NTIC, CHC. Cluster 1 (moderate-conservative Dems) has Blanche Lincoln (D-AR), Mark Pryor (D-AR), Evan Bayh (D-IN), Mary Landrieu (D-LA), Baucus (D-MT), Ben Nelson (D-NE), Lieberman (D-CT), Carper (D-DE), Stabenow (D-MI), Schumer (D-NY), Murray (D-WA) and Cantwell (D-WA).
And on the other side?
There was a rabid right wing cluster, and a more moderate cluster (with only 5 people): Snowe and Collins of ME, McCain, Specter (PA) and Chafee.


